There is a new and better Analytics section available for users running WordPress 5.3+. Learn more about the new reports and admin experience in the WooCommerce Analytics documentation.
Reports in WooCommerce give you the ability to see your store’s performance from month to month using graphs and stats. It has four sections: Orders, Customers, Stock, and Taxes.
To view them, go to: WooCommerce > Reports.
Orders
↑ Back to topOrders allow you to view gross and net sales volume and totals, as well as top sellers, top freebies, top earners, and product downloads. Sub-sections are shown below.

Sales by date
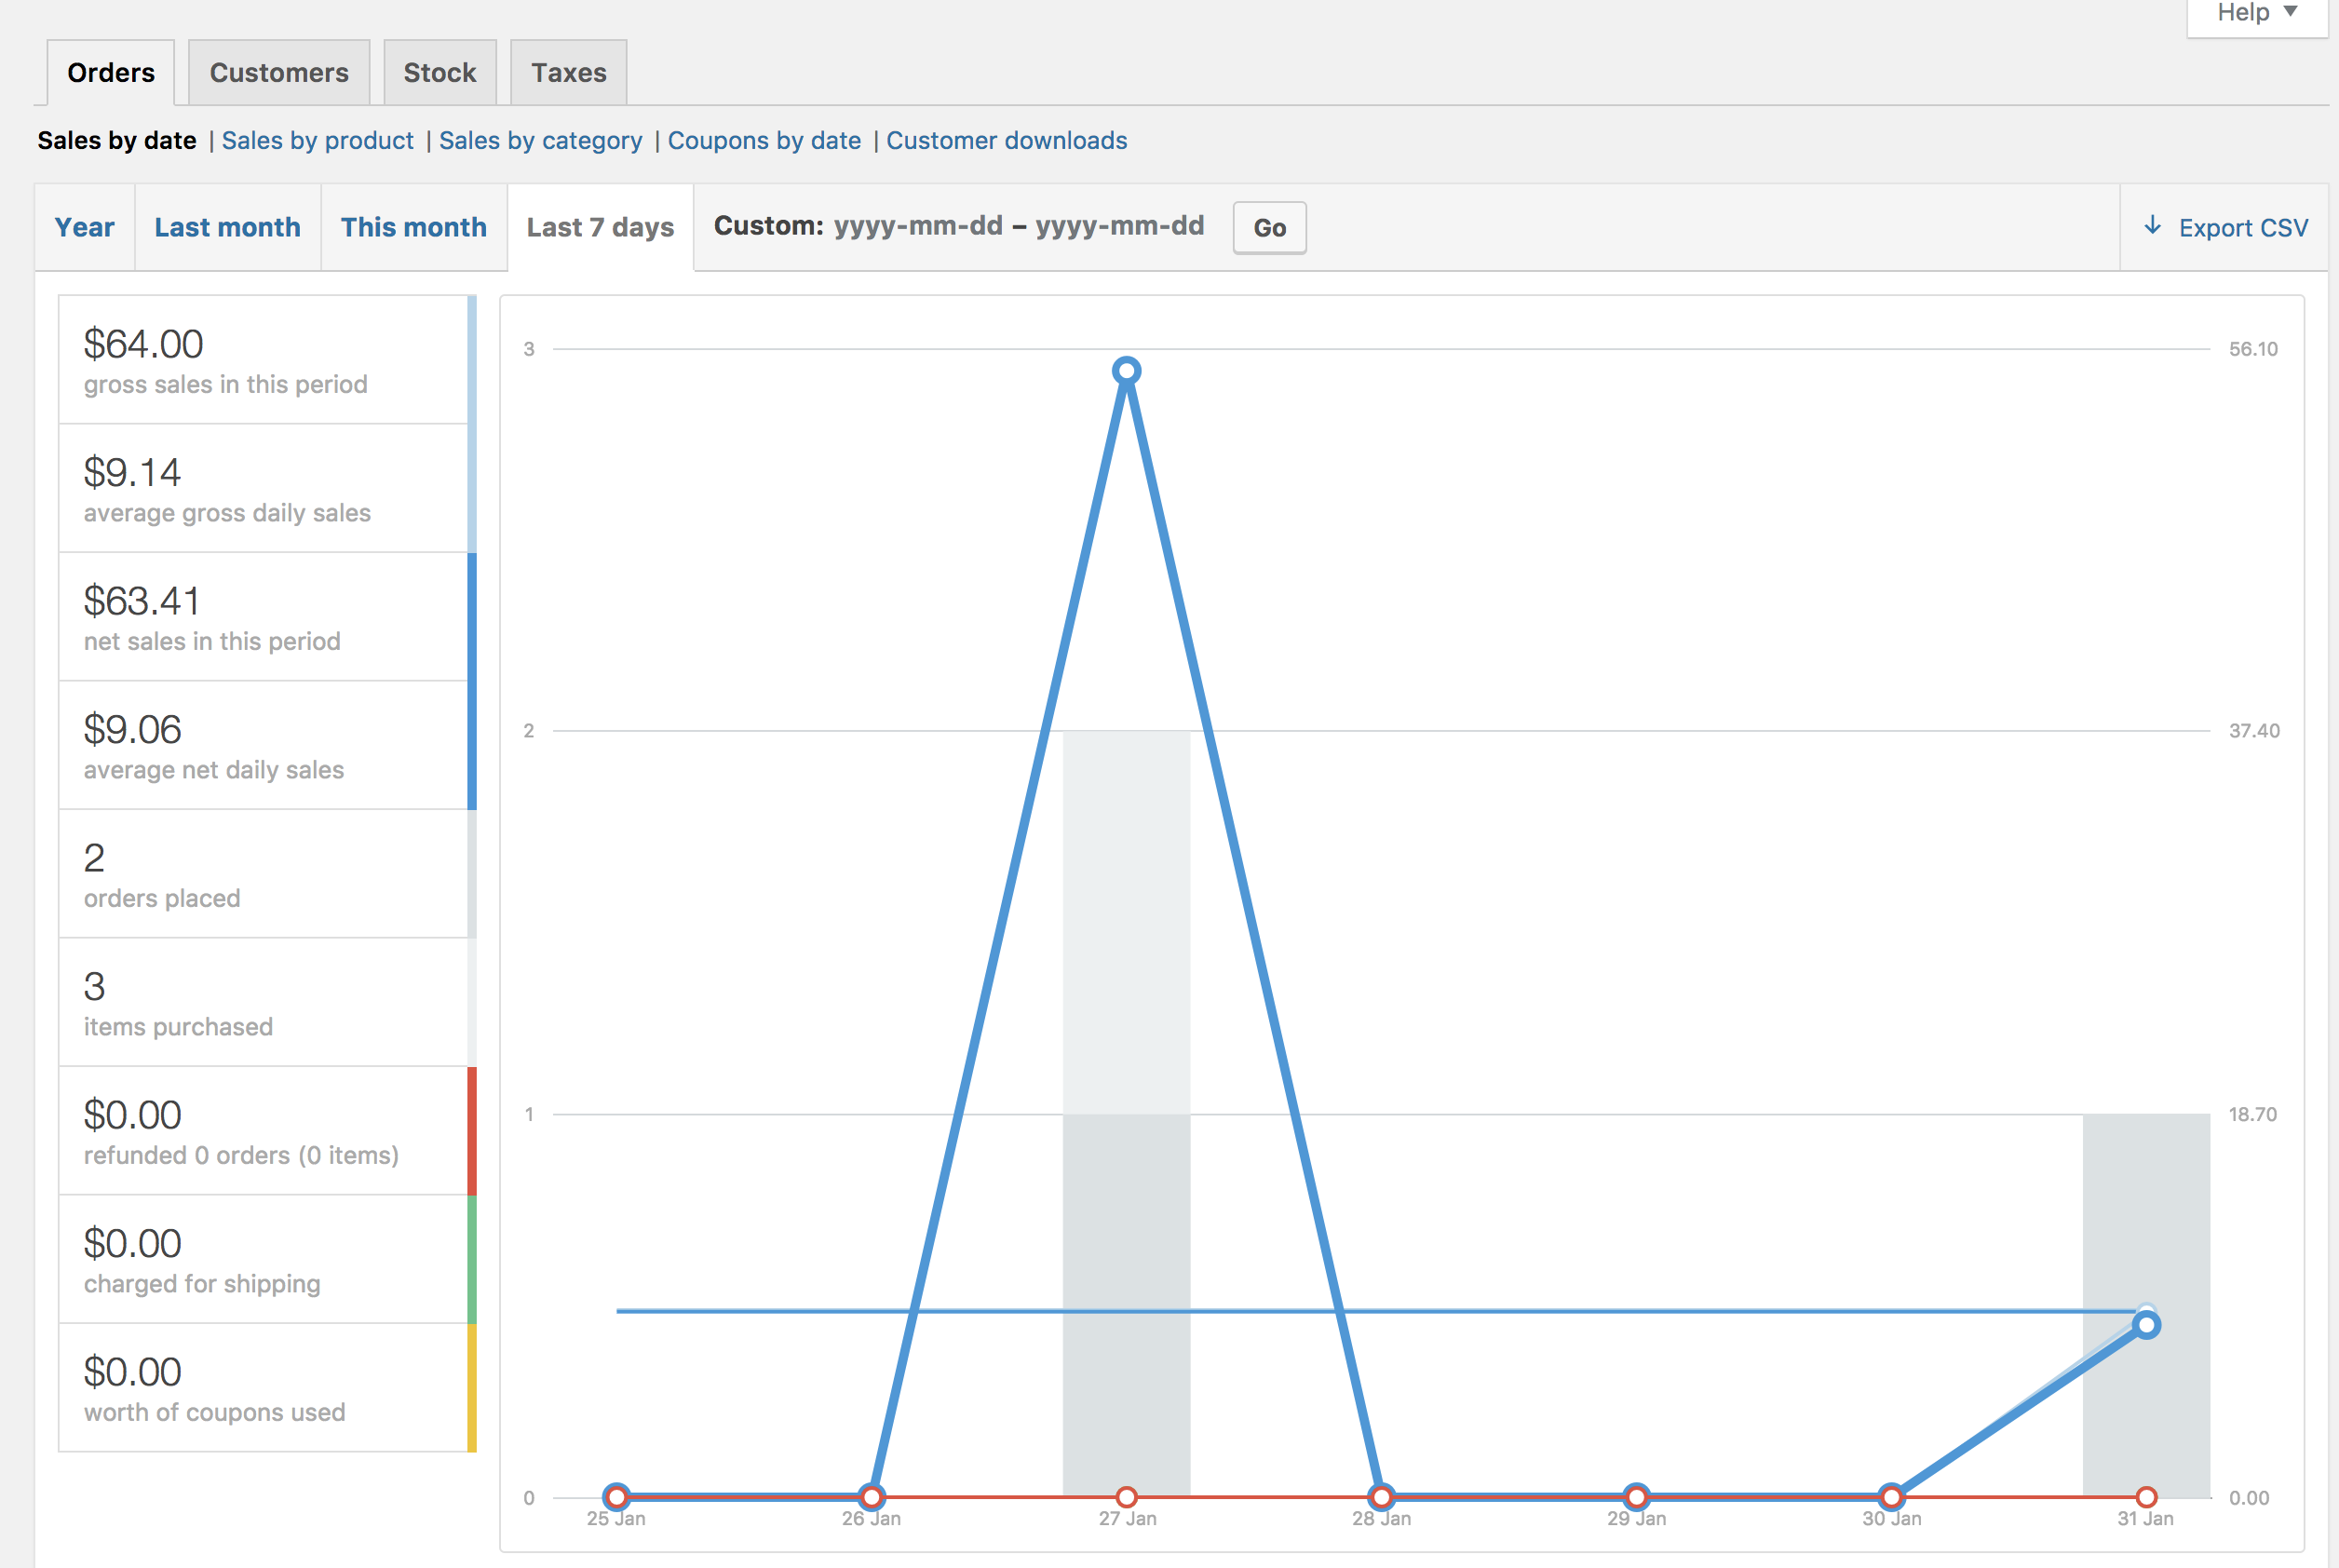
↑ Back to topThe Orders tab starts with Sales by date. This gives you an idea of the current performance via a sales graph and a few way ways to drill down into data. By year, last month, this month, last 7 days, and a custom date range.
The sales graph itself shows the number of gross sales plotted on a light blue line, the net sales plotted in dark blue, the shipping amount plotted in green, refunds plotted in red, and coupon values redeemed in orange. Hovering over a point will give you the exact figure.
Sales by product
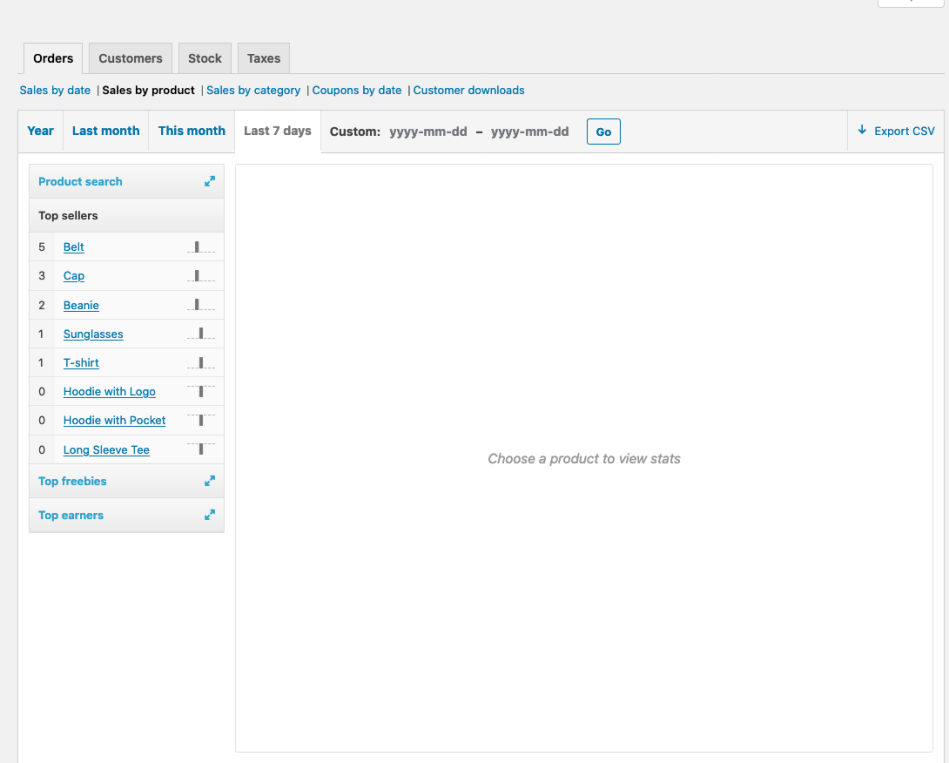
↑ Back to topThe sales per product section shows sales per day in a given range, similarly to the overview section:

You can select any product from your store to view sales data, and again drill down into by year, last month, this month, last 7 days, and custom.
Sales by category
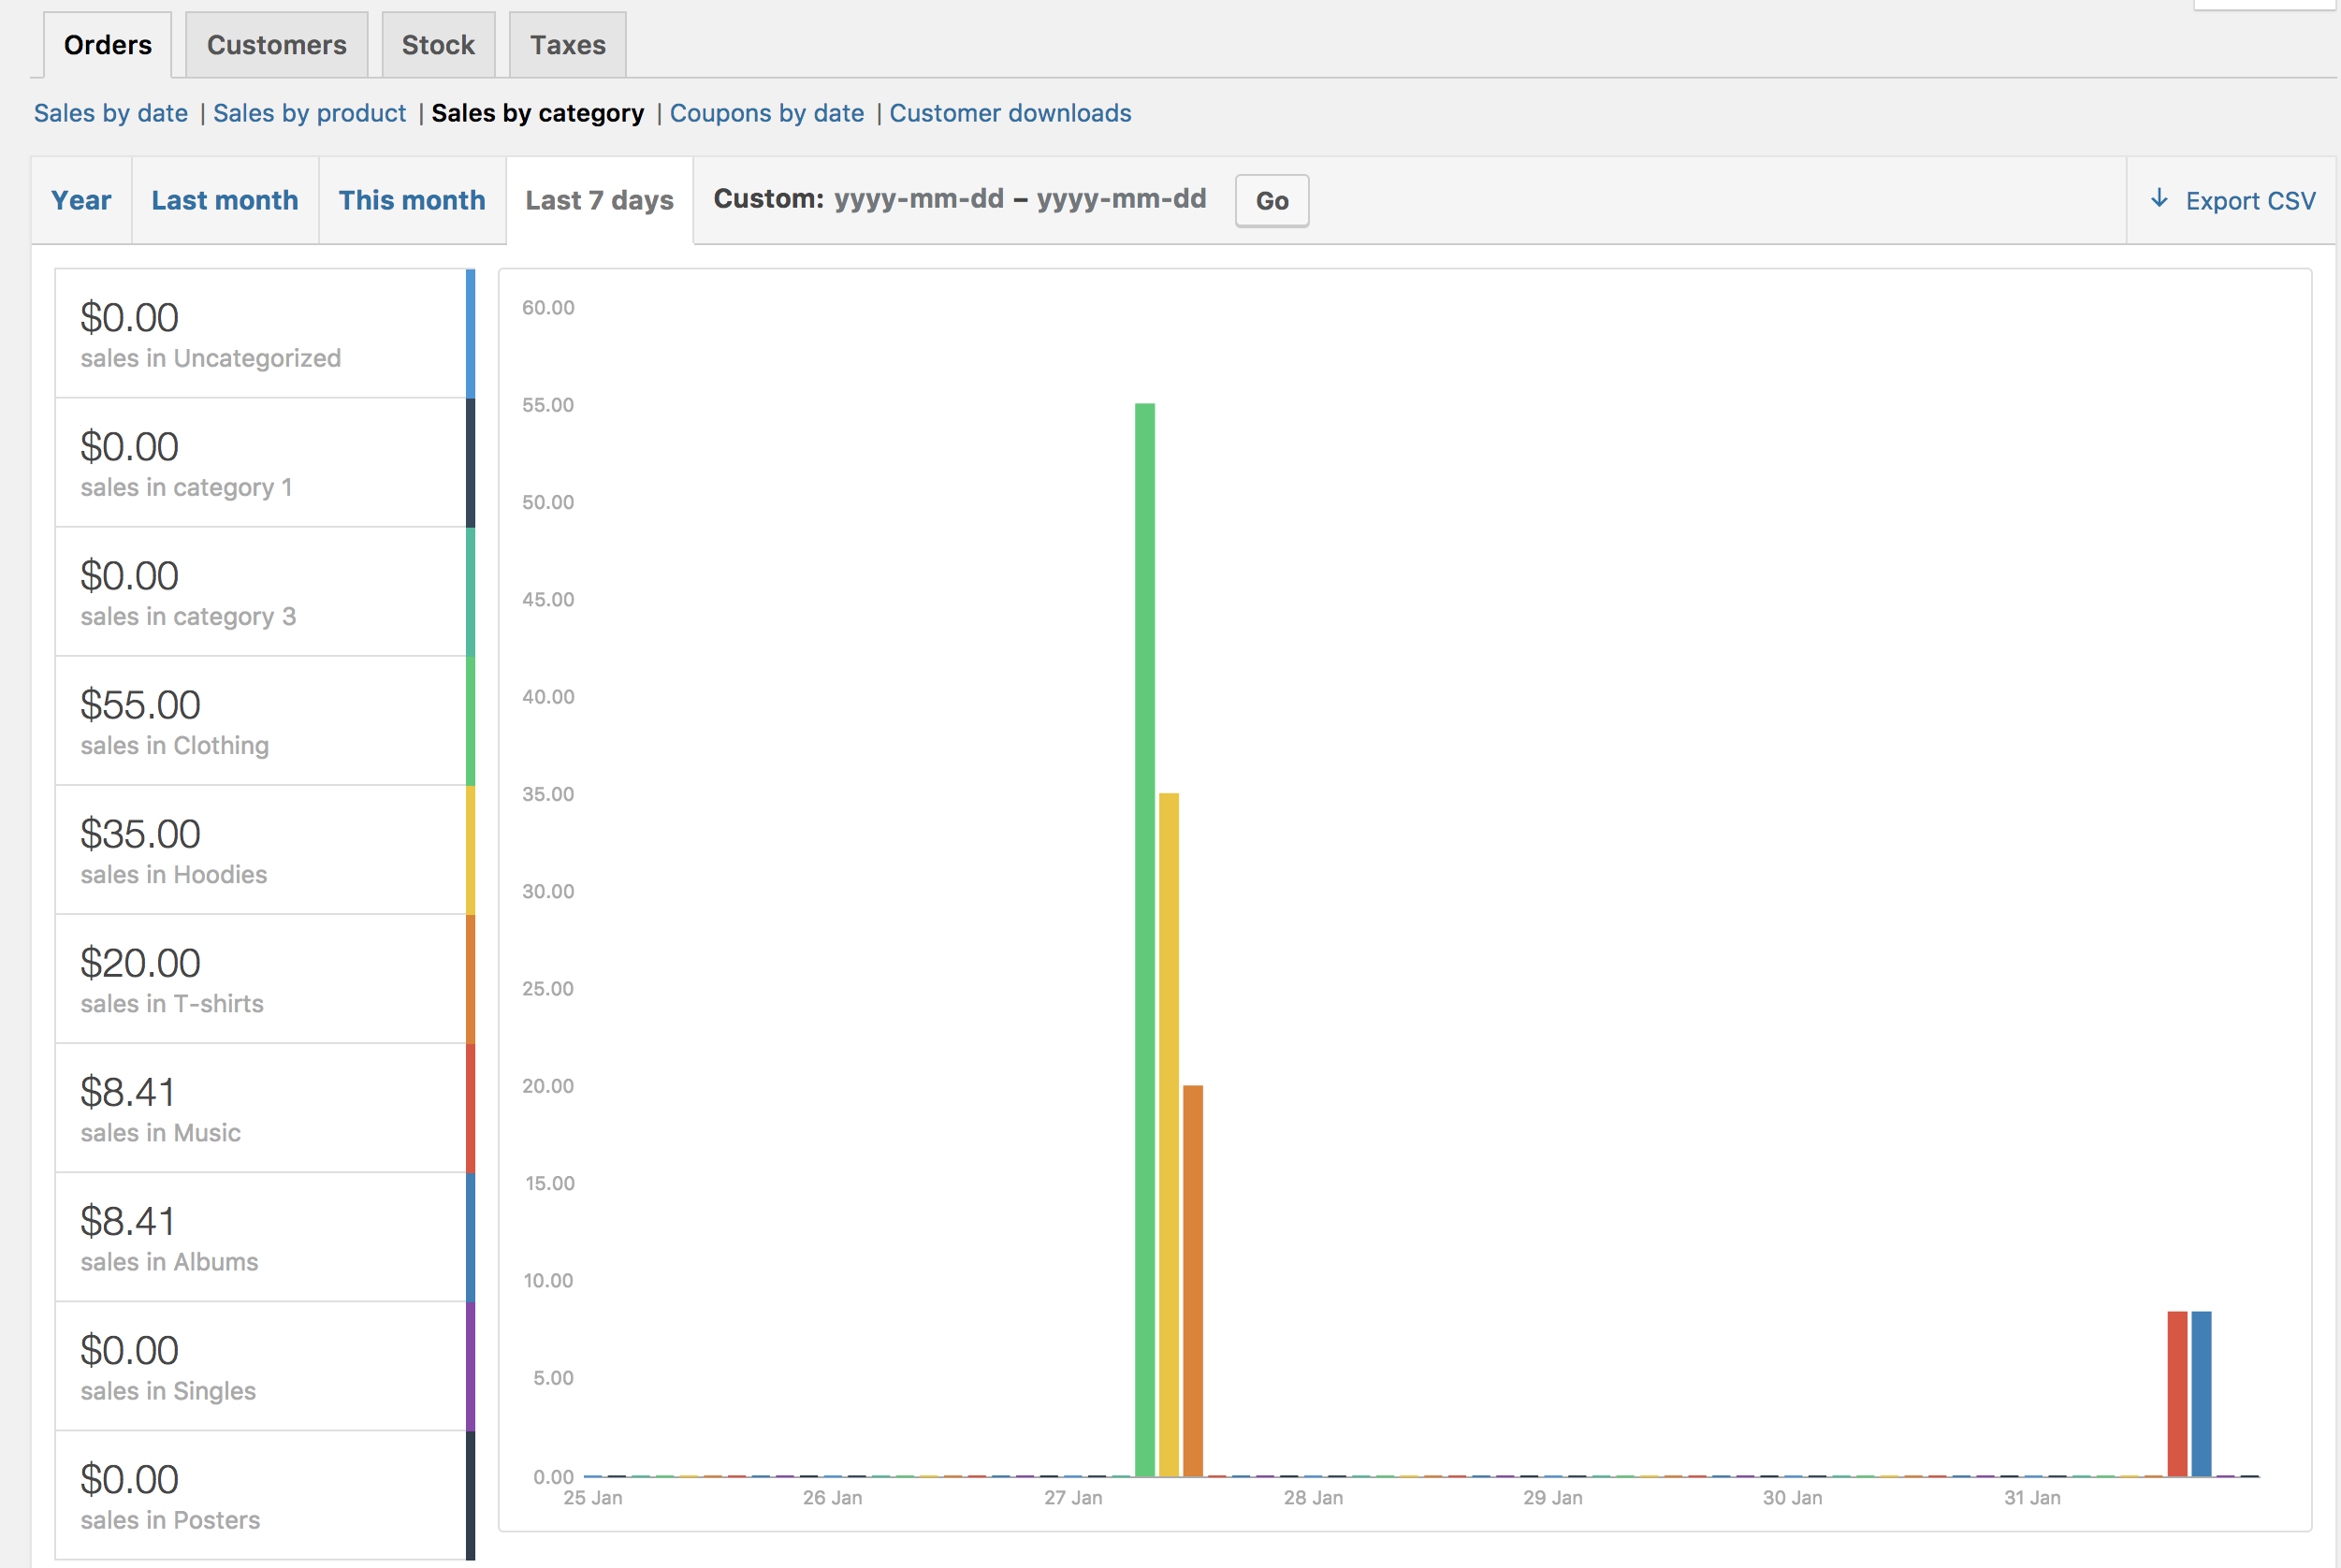
You can also view sales numbers by category.
- In the Categories widget, select the categories you want to review. (Or select “All”)
- Then, select “Show”
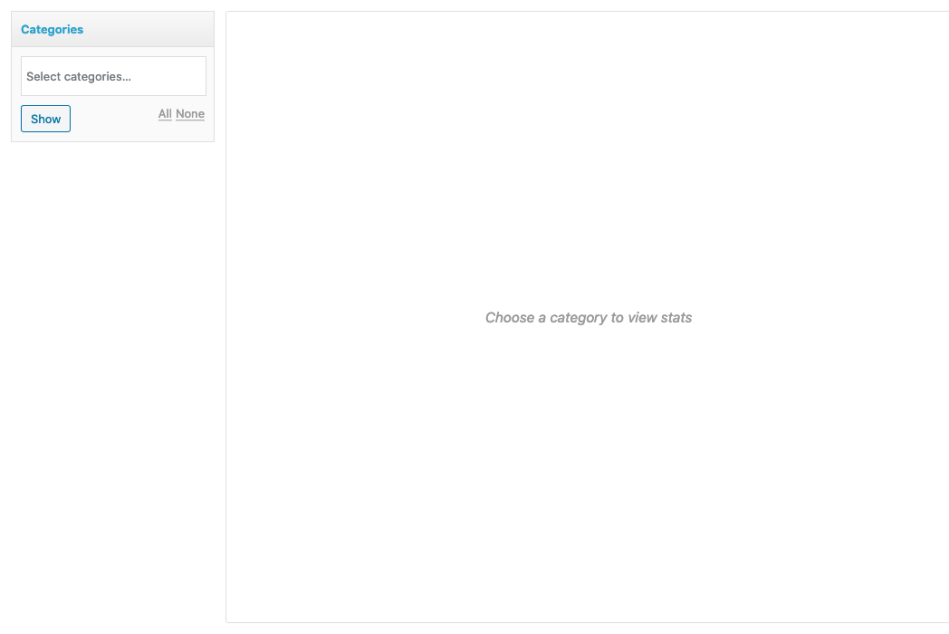
You will now see the categories you’ve selected and their sales report.
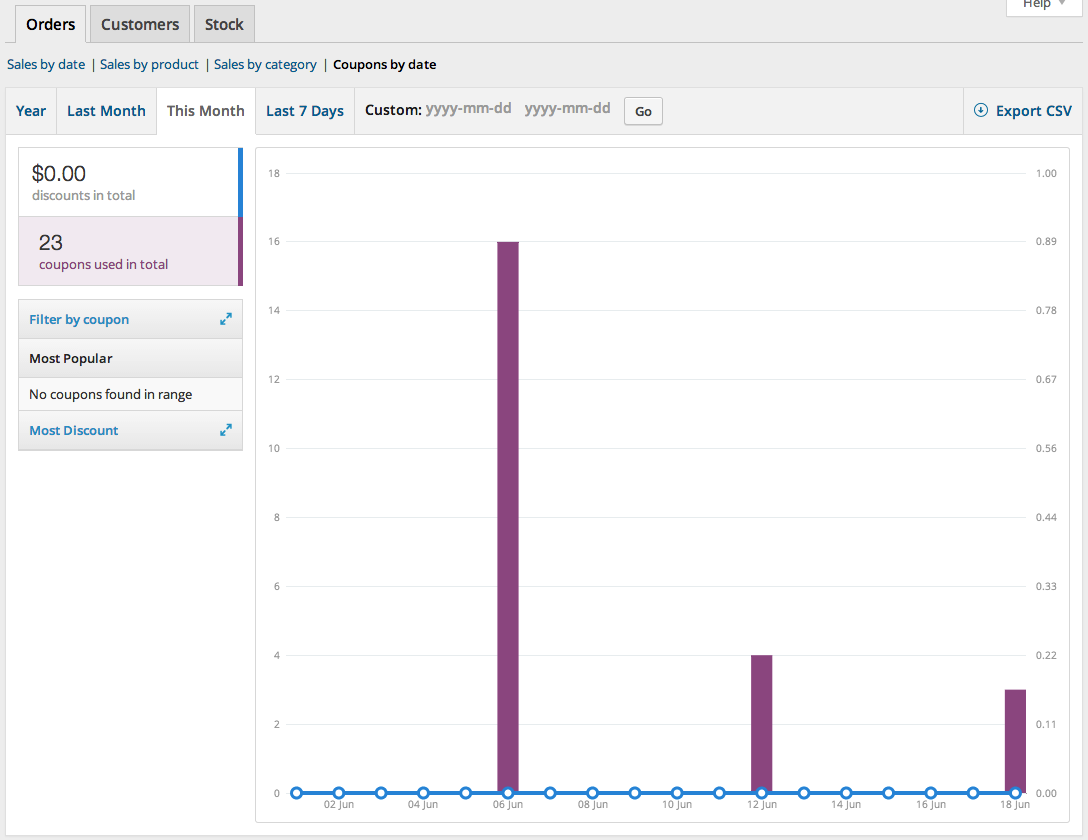
Coupons by date
↑ Back to topSimilar to the previous sections, coupons by date shows discounts in total and number of coupons used, plus provides the ability to filter by coupon, view the most popular coupons, and coupons giving the most discounts.
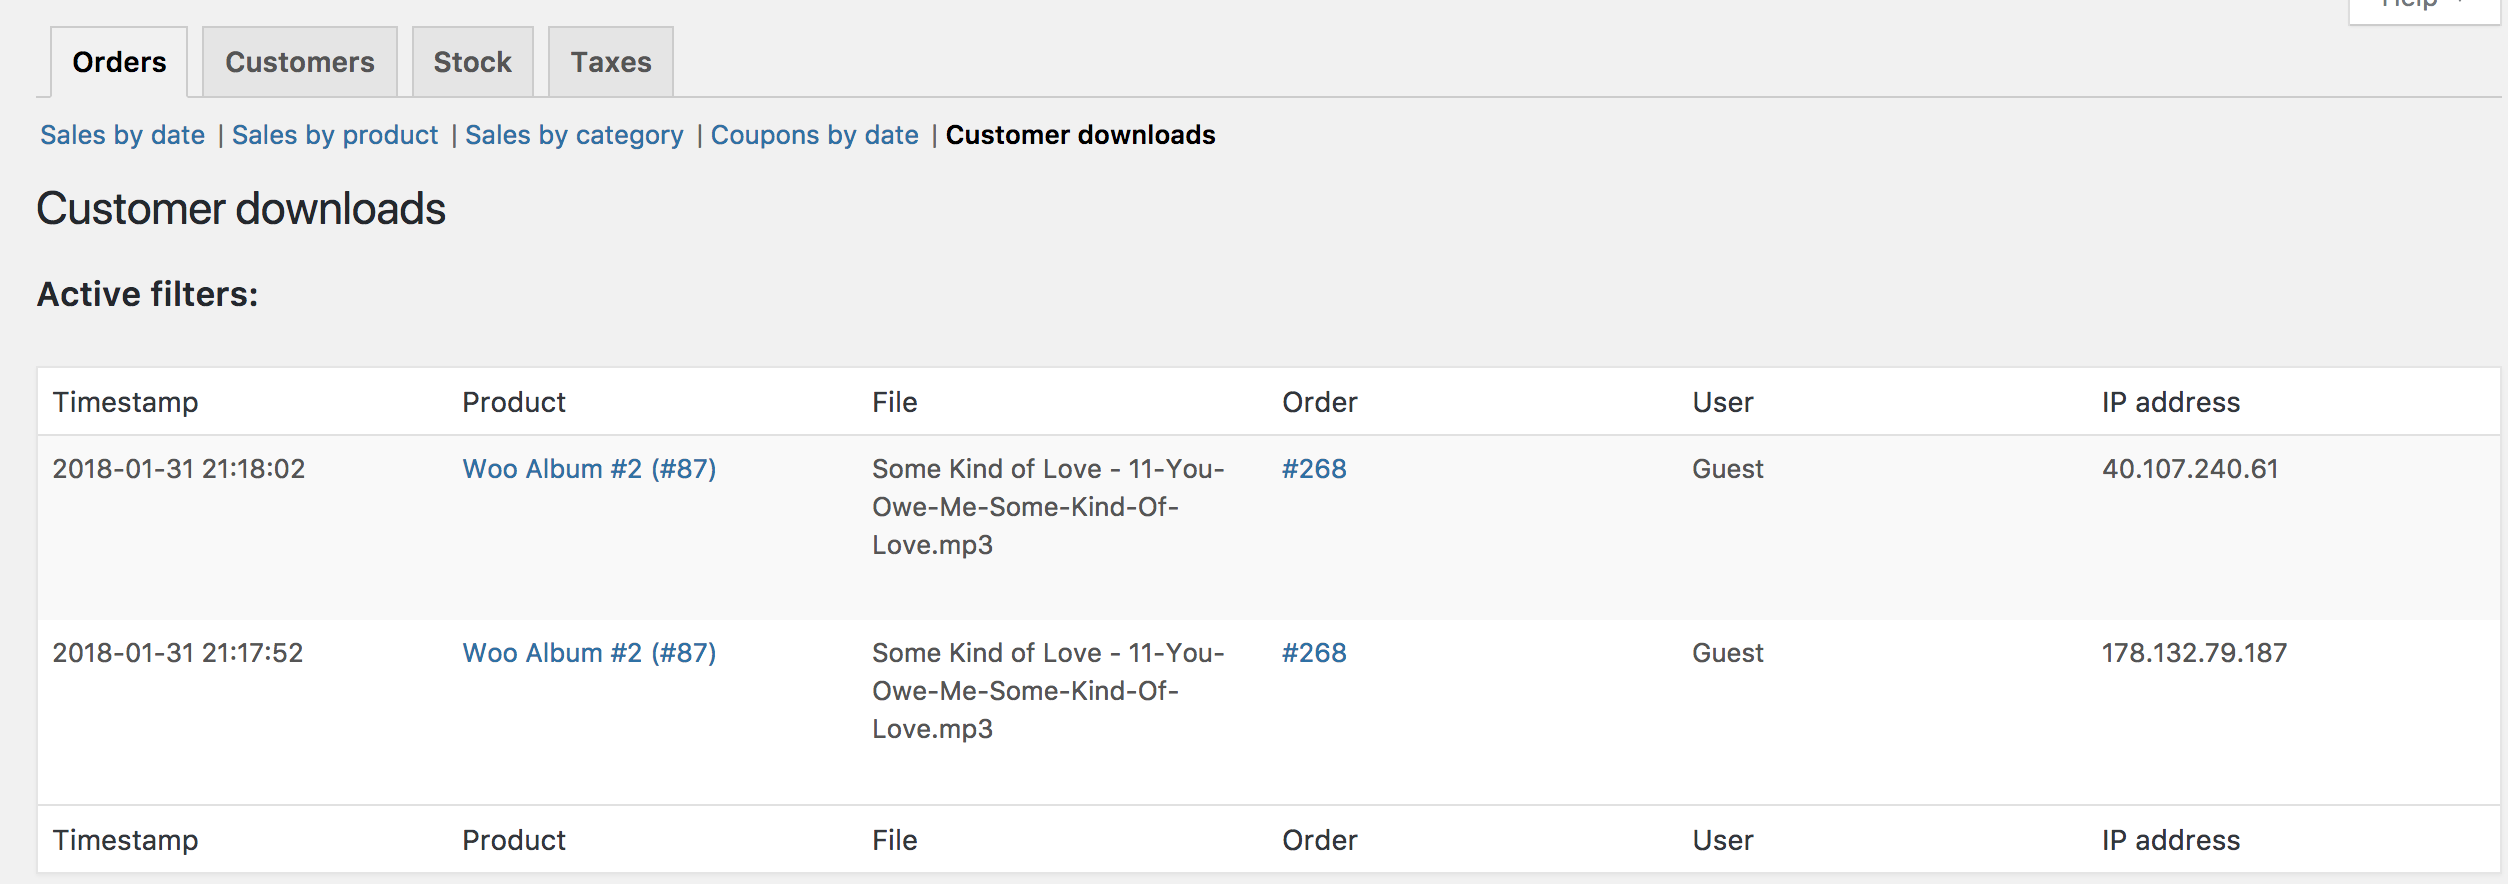
Customer downloads
↑ Back to topDownloads have unique IDs, enabling them to be tracked and logged, and making it possible to view when it was downloaded, which products and the file name, on what order (clickable link), and where the customer is located via IP address.
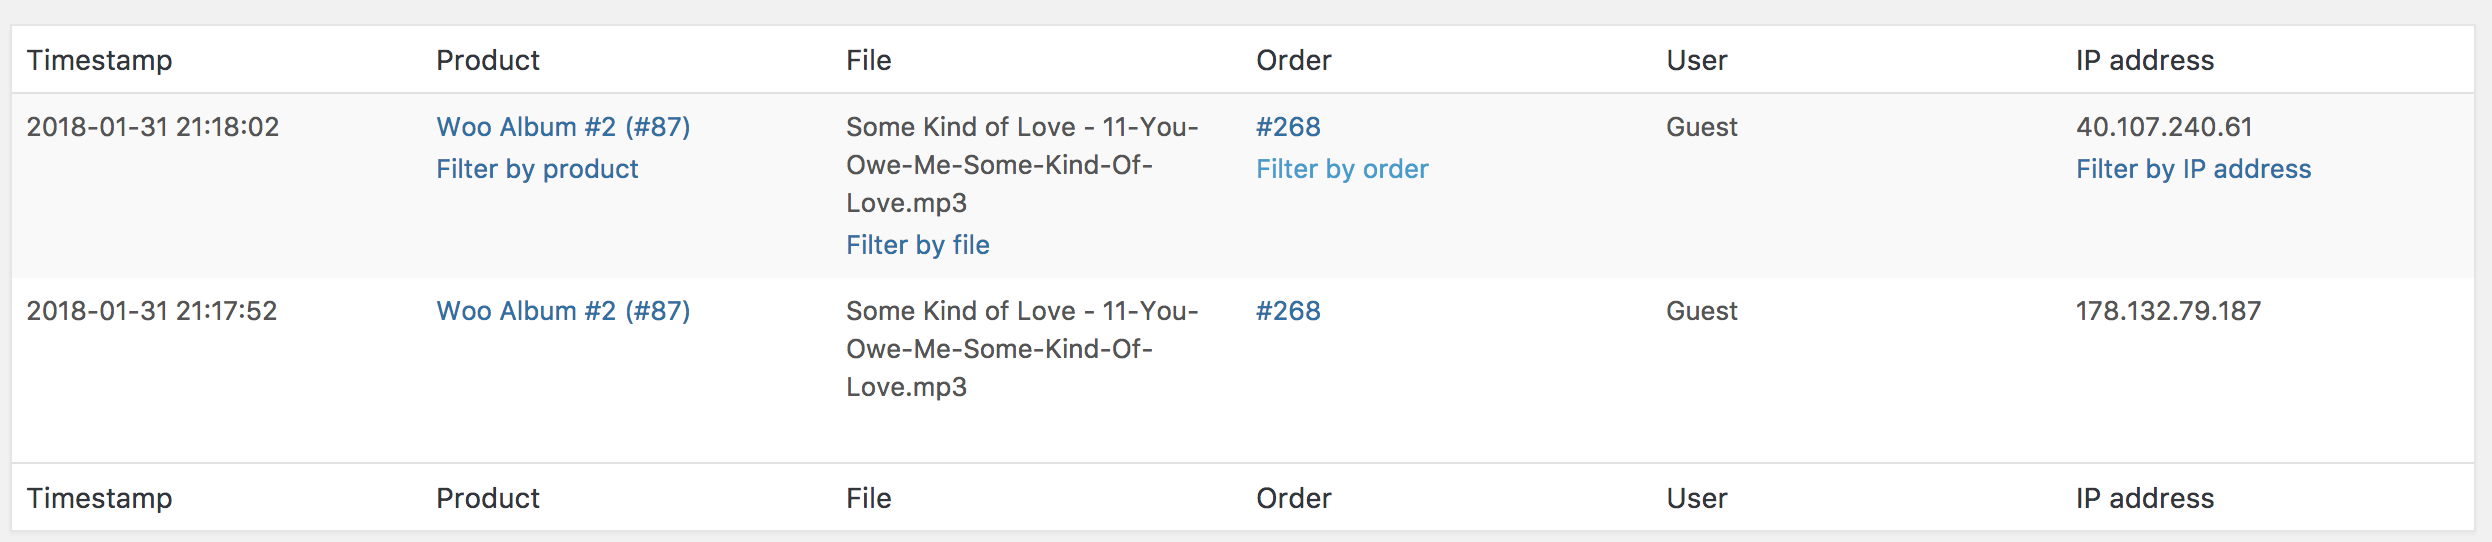
It’s also possible to filter downloads by hovering over Product, Order or IP address.
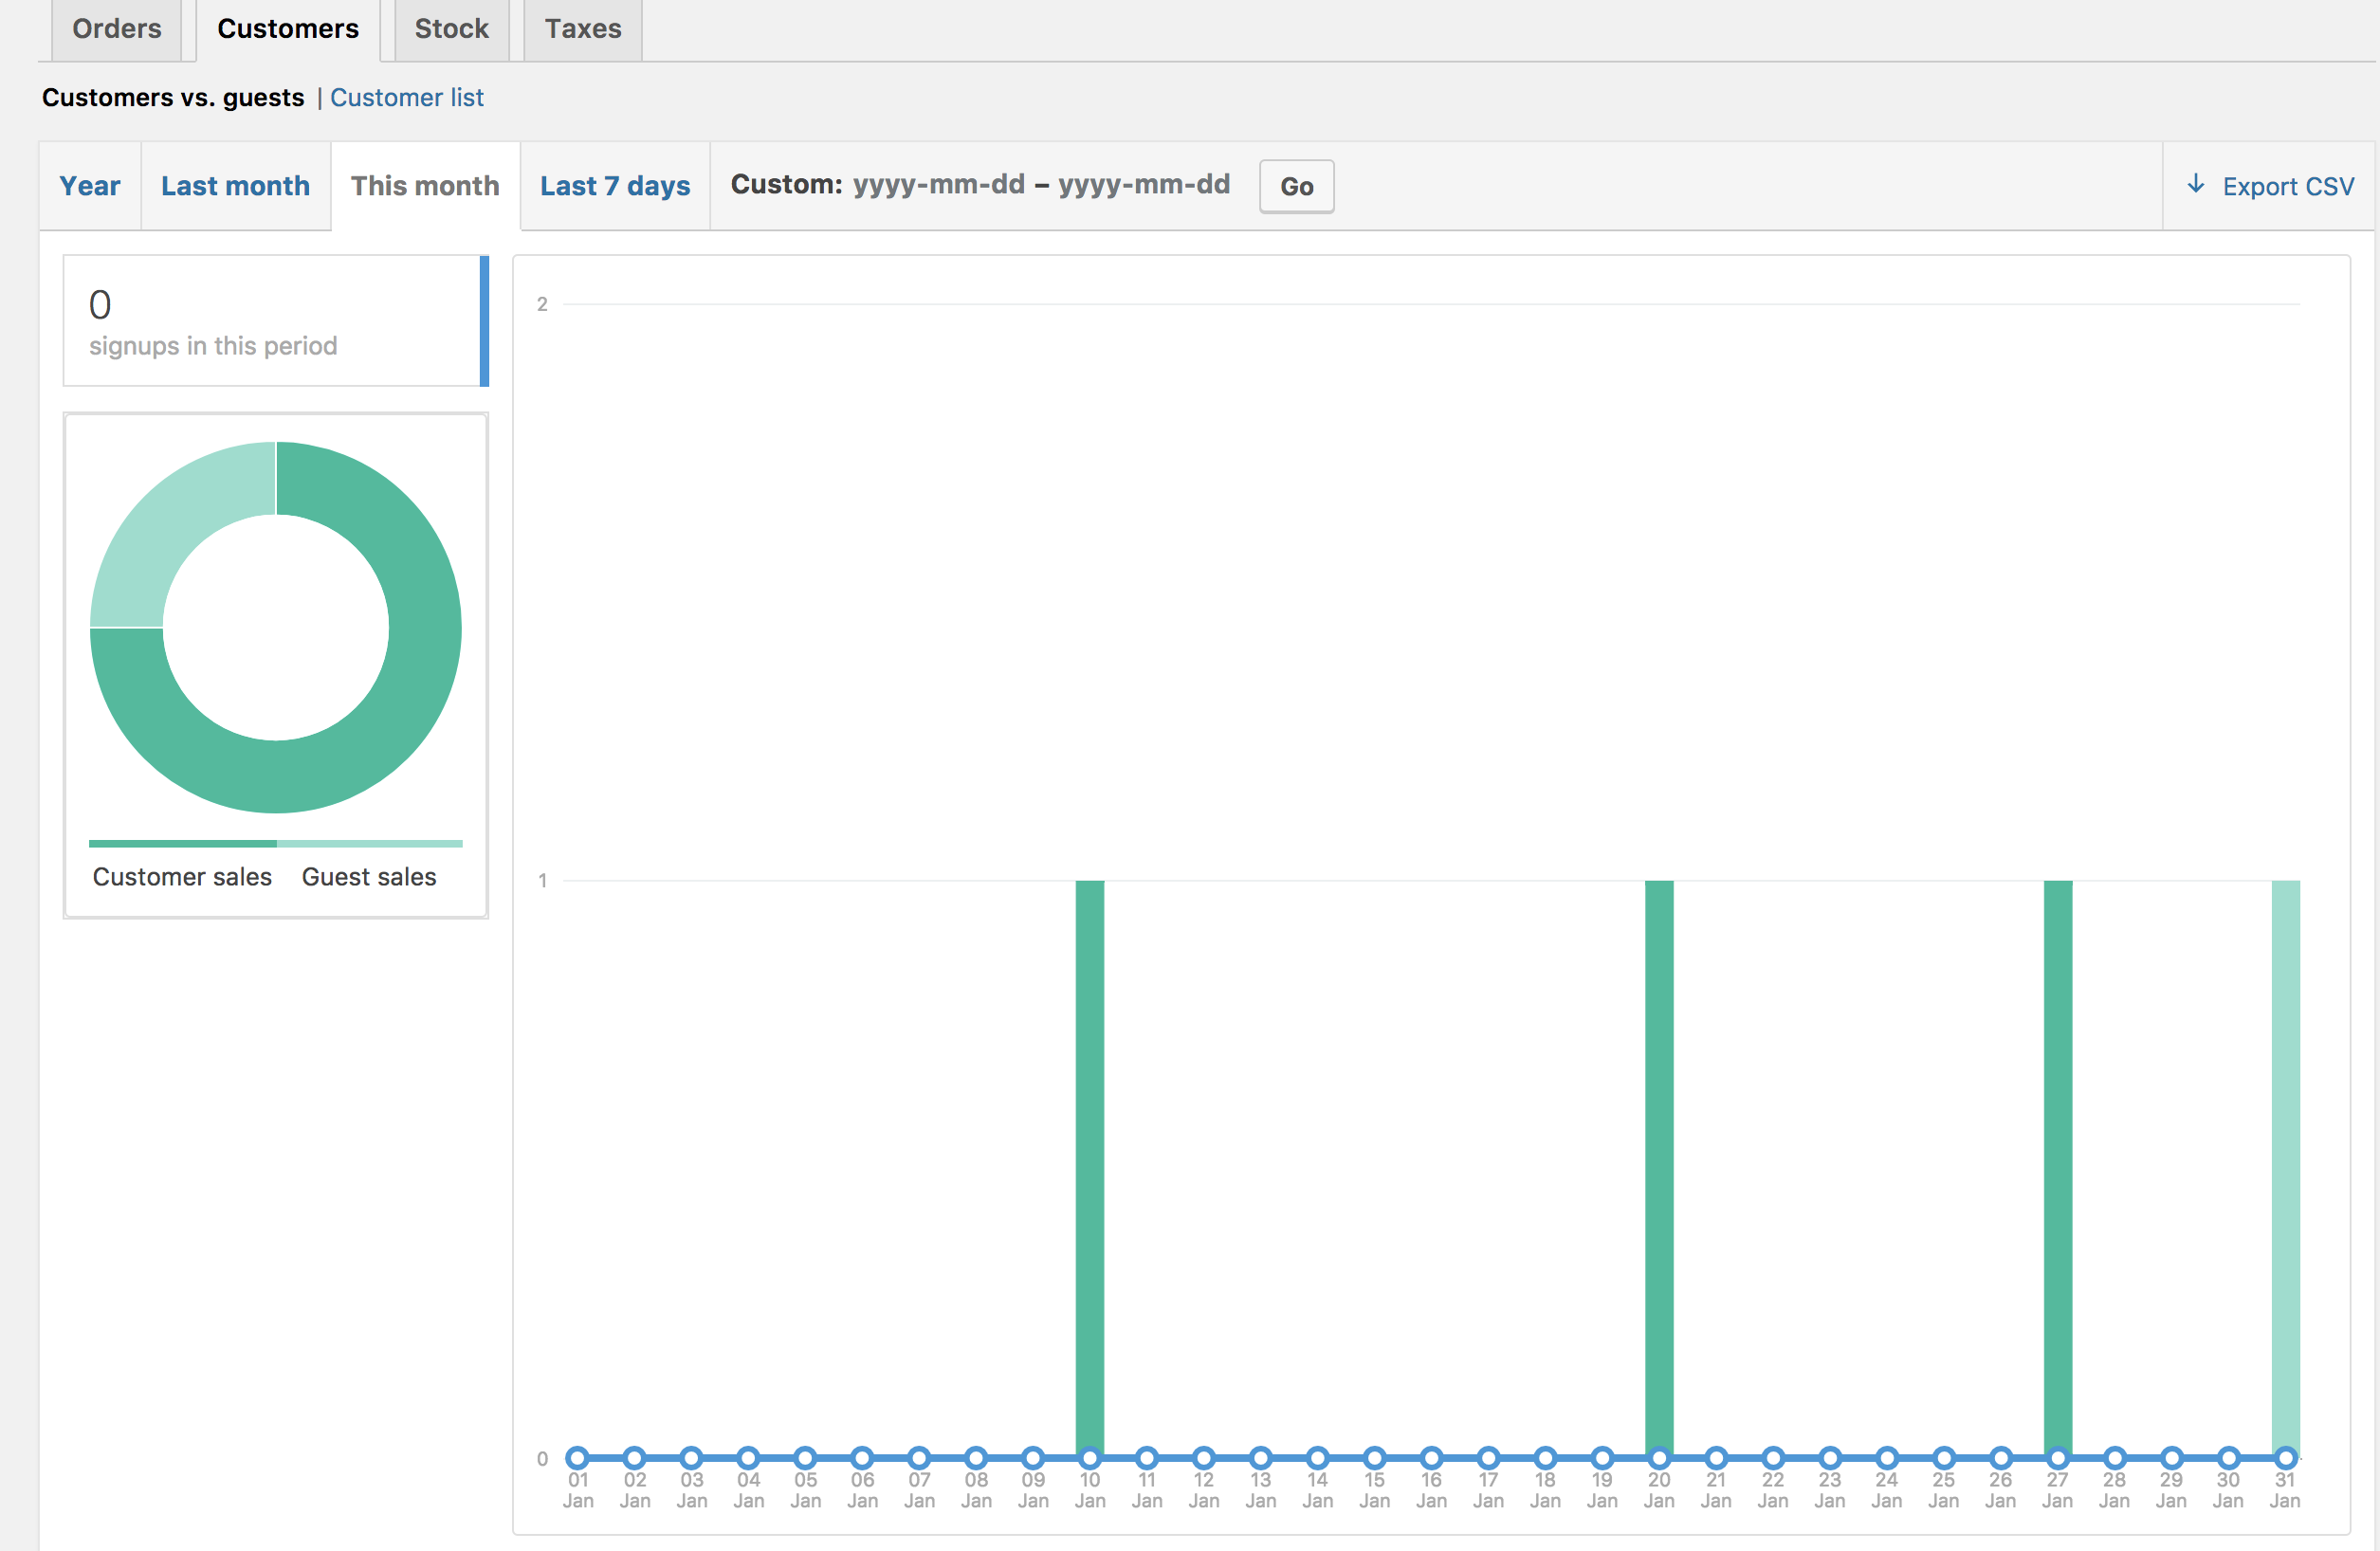
Customers
↑ Back to topThe Customers tab allows you to view reports for Customers vs. Guests and Customer List with options to further sort by year, last month, this month, last 7 days, and custom.
- In Customers vs. Guests, customers are paying users who register on your website.
- Customer List only shows registered users.
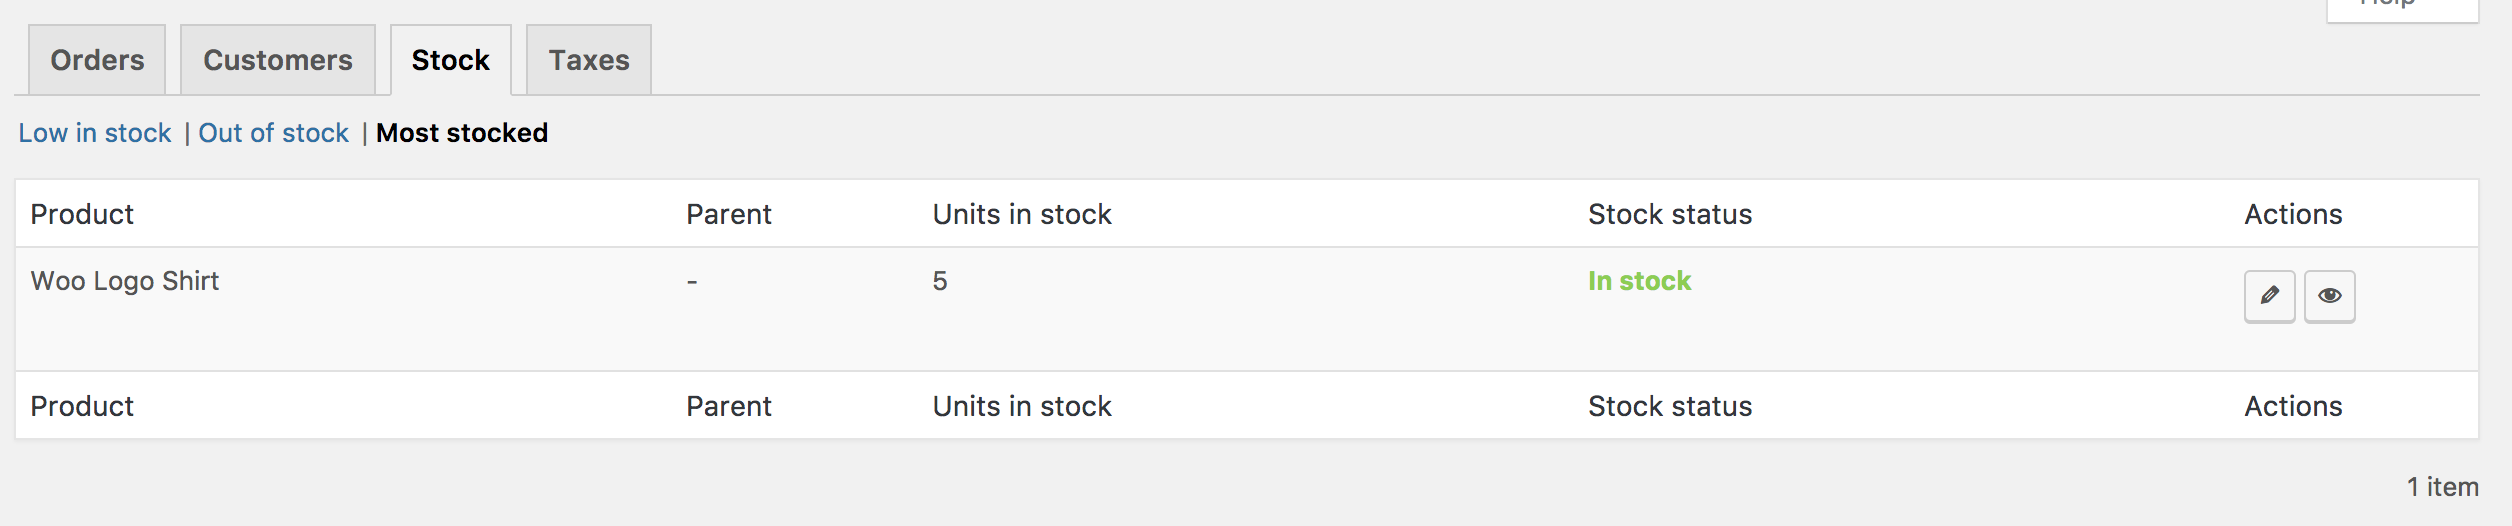
Stock
↑ Back to topStock lists your low in stock, out of stock items, and most stocked products.
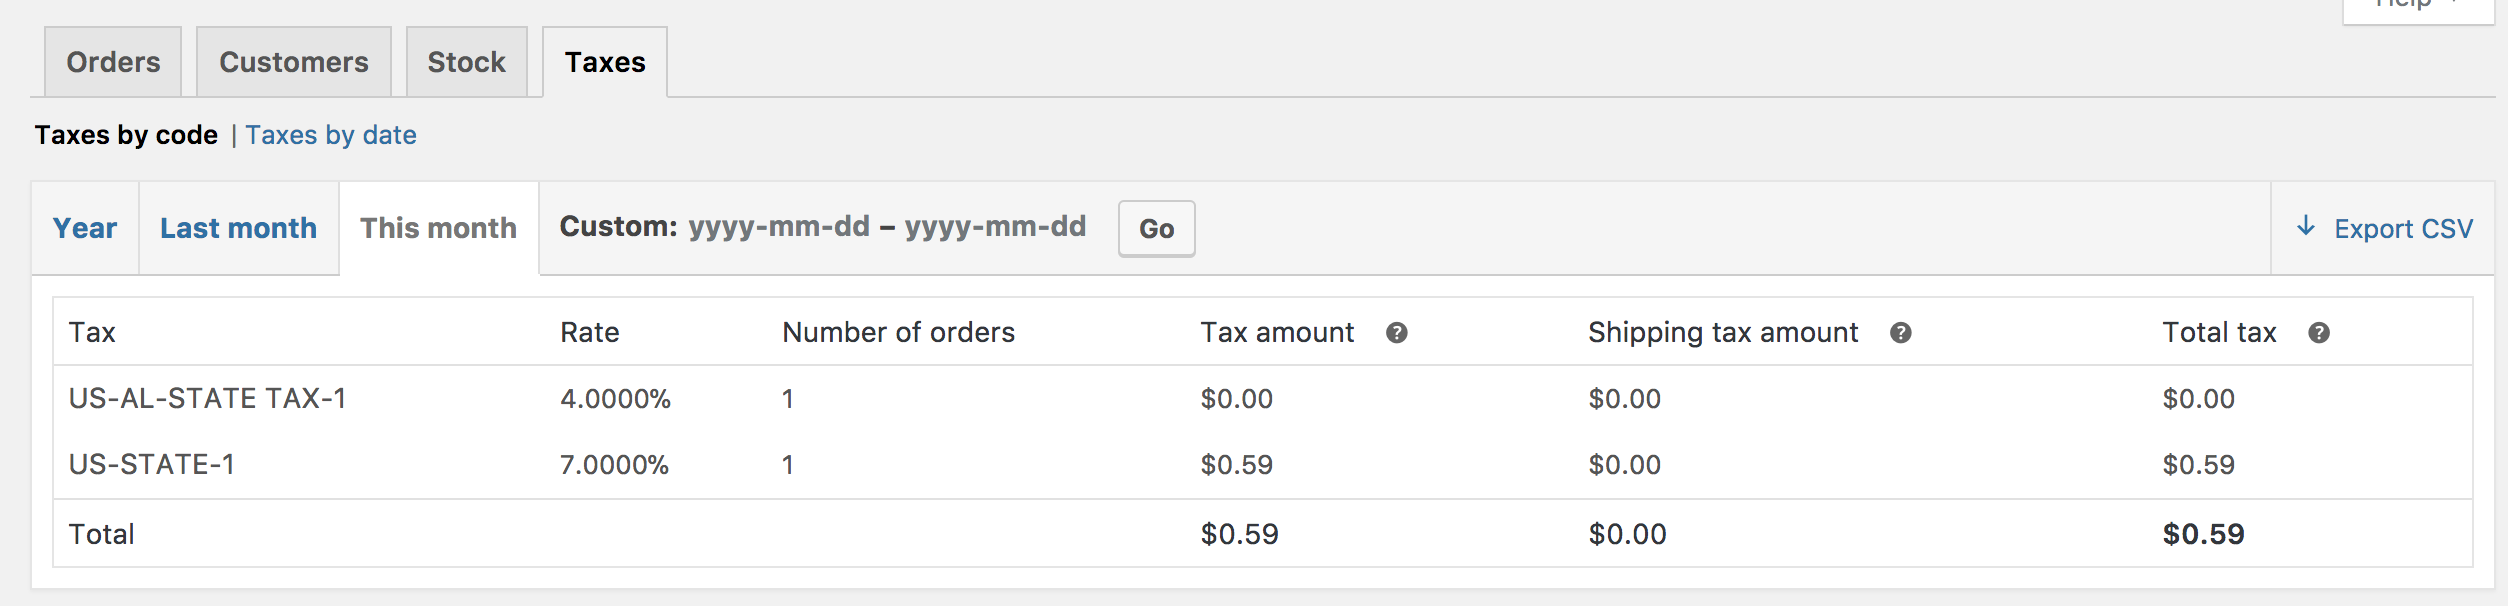
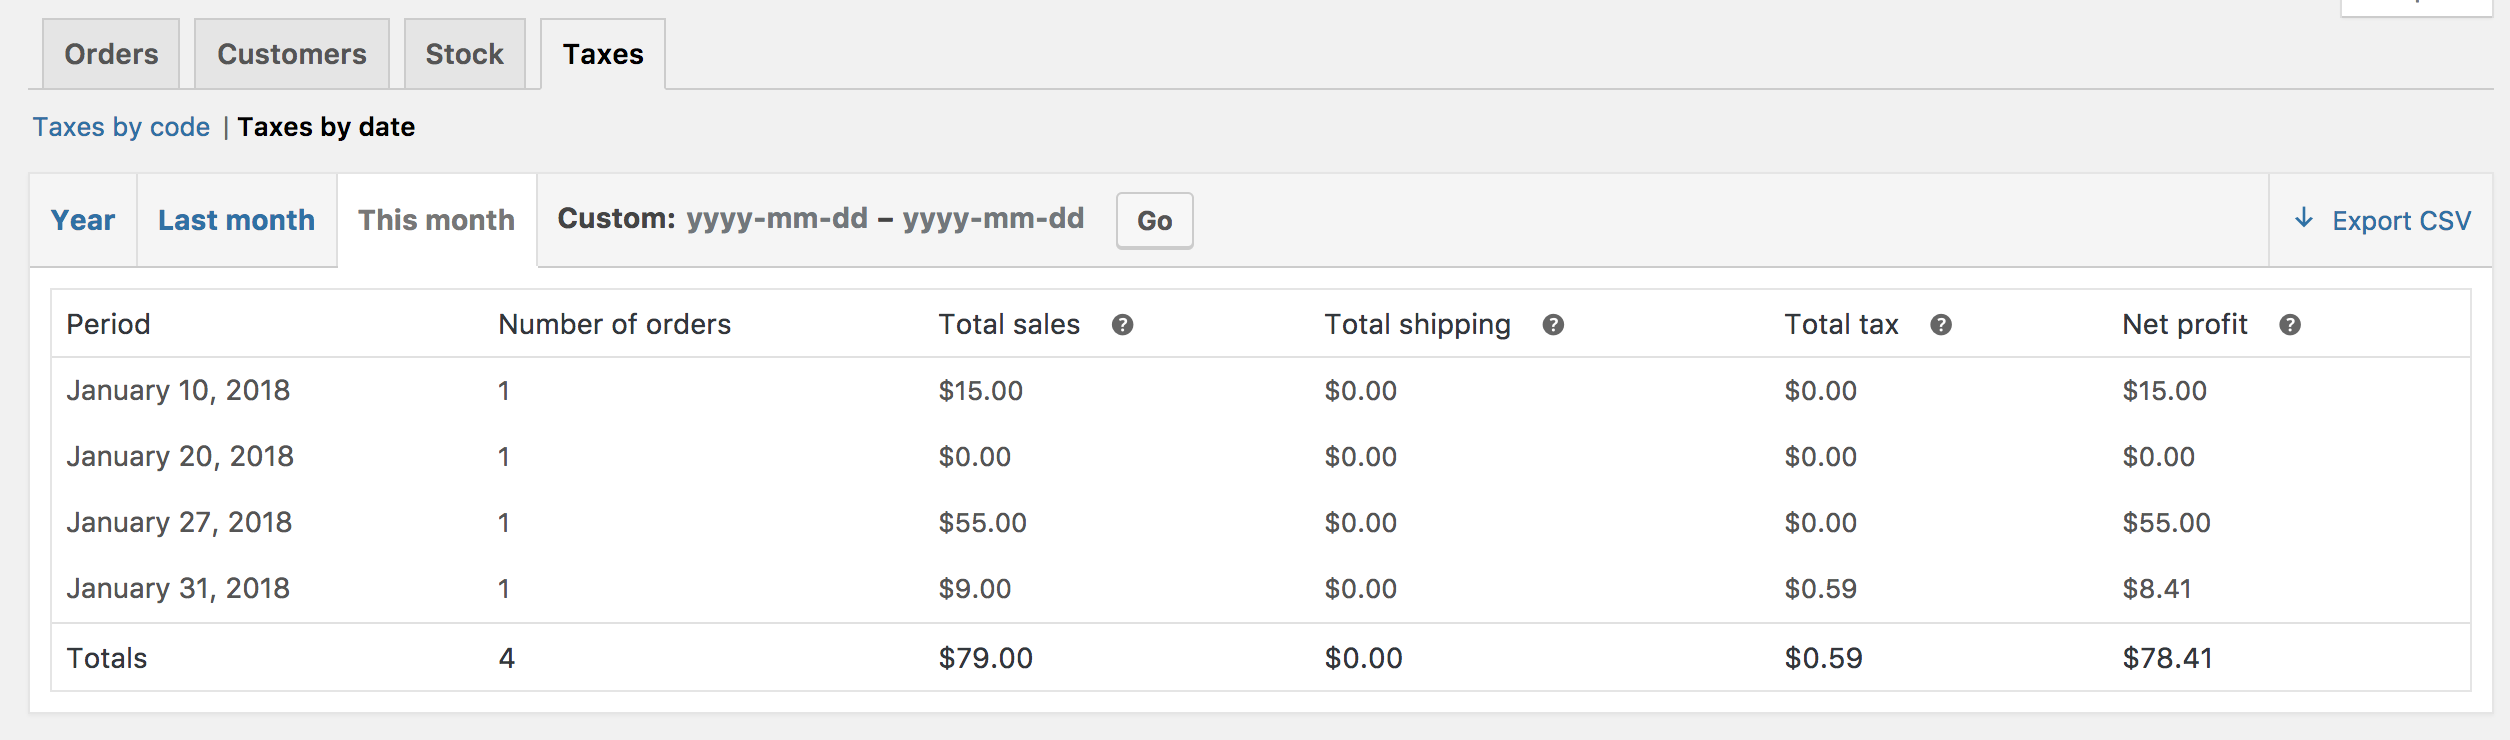
Taxes
↑ Back to topThe reports for Taxes allows you to view Taxes by code (state) and Taxes by date. by year, last month, this month and custom dates you enter.
Export CSV
↑ Back to topAll reports besides the stock one have the option to export to CSV.
- Select Export CSV
- Save or view the file

The Export CSV feature is hidden from browsers without support for the Download property.
Frequently Asked Questions
↑ Back to topHow do I reset the report?
↑ Back to topYour report data can only be reset by deleting prior orders, customers, etc… It’s not something we’d advise doing.If you do this all sales graphs and sales logs are dynamically generated, you then need to clear your browser cache to see reset reports. The new Analytics experience doesn’t require you deleting actual historical data to reset reports. We’d recommend using those going forward.
Is there a ___ column for this report?
↑ Back to topThe only columns and categories available are those shown. If you require a different or additional one, then it would be customization requiring custom code or a plugin to add that feature/functionality.
Questions and Support
↑ Back to topDo you still have questions and need assistance?
This documentation is about the free, core WooCommerce plugin for which support is provided in our community forums on WordPress.org. Searching there you’ll often find that your question has been asked and answered before.
If you haven’t created a WordPress.org account to use the forums, here’s how.
- If you’re looking to extend the core functionality shown here, we recommend reviewing available extensions in the Woo Marketplace.
- Need ongoing advanced support, or a customization built for WooCommerce? Hire a WooExpert agency.
- Are you a developer building your own WooCommerce integration or extension? Check our Developer Resources.
If you weren’t able to find the information you need, please use the feedback thumbs below to let us know! 🙏